Top Six Trends in Data Virtualization
Breaking Down Data Silos
Effective data management has proven to be difficult for many organizations. As a result, many organizations find themselves stuck with a number of data silos. A data silo is data that is not fully accessible to everyone within the organization. Different departments require different data that often gets stored in separate locations. Data silos create barriers in information and collaboration. Inconsistency and lack of real-time data makes data silos harmful to the quality of data. Therefore, data silos hinder the overall insights of an organization and clutter enterprise systems. Data virtualization allows organizations to have a single source of truth by logically centralizing meaningful data in a single repository to be used for Business Intelligence.

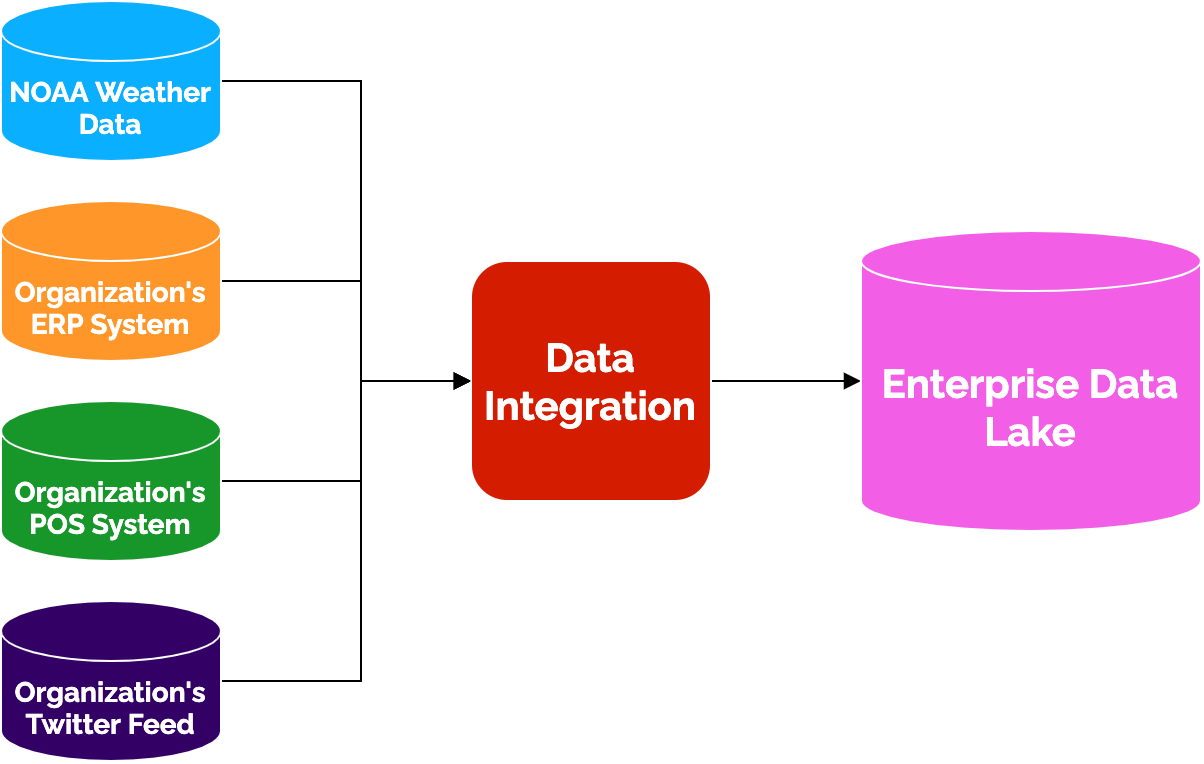
Wiweeki’s product, Loxio, successfully breaks down silos with the help of the data ingestion module. The data ingestion module is used to make data available for use in your organization for things like business intelligence or data analytics. Data can reside in various places and data ingestion consolidates the data. The data need not be physically moved or duplicated to consolidate them. Instead, because of data virtualization and tools like Loxio, you can query the siloed systems from a single system. Now, you have all the data you need at your fingertips.
Expanding data models to include external data sources
In many cases, data stored within a system may not be enough for an organization to create meaningful insights or actionable intelligence. Organizations often need to integrate data from internal and external (third-party) sources which are the authoritative systems for the data. Data models can be expanded with the integration of data from other organization systems and external sources to allow for more powerful analytics. A data model represents an event such as the purchase of a product. A basic data model will represent basic attributes like who bought it, when, where, and for how much. These attributes are typically found within the organization’s point of sale (POS) system.
However, the data model can be expanded to add more attributes that will provide more detail to your insights, like what the weather was when the item was bought, the payment method, and even the purchaser's rating of the item. It is likely that these attributes are not in the POS system, so we have to call onto third-party sources to access that data. For example, an organization can integrate data from NOAA’s weather database. Having data from internal sources as well as third-party sources enriches an organization’s data and allows for more in-depth analyses. By integrating data from their authoritative systems, you have now created a single source of truth for your organization.

Loxio supports integration with internal and third-party sources to expand an organization’s data model. With the help of Loxio, you can easily bring in the needed data from various sources for enrichment purposes. The beautiful thing about data virtualization is we don’t have to store all the data from NOAA’s weather database in Loxio. Instead, we can create a data virtualization so end users have a window into the weather database. With all the necessary data accessible through Loxio, Loxio now becomes the single source of truth.
Developing A Data-Sharing Culture
Data virtualization promotes a data-sharing culture. Having a logically centralized repository containing all of an organization’s data that can be shared amongst other organizations and researchers can have a great impact on current research and future research. According to the International Development Research Centre (IDRC), “The dissemination of research data can accelerate collaboration, scientific discovery, and even follow-up of research efforts. Open access to research data can be particularly important to researchers in developing countries as they may face additional institutional and financial barriers to access and archive data." The old way of sharing data consisted of having to copy the data from one silo to another. But with data virtualization, it is much easier to make data available where people can access it without having to physically move it over to your own system.

There are multiple departments in an organization, each with their own territories of data. The collaboration between the two teams is completely lost. Imagine the value that could be added to the organization if these teams brought their data together and enriched it. That’s what Loxio aims to do. With virtualization, you are still maintaining your own data but you are giving readable access to other parties.
Combining Data Integration Styles
There are many different methods of data integration. For example, data integrations can be done through web services. You make a web service call and they give you the data relevant to your request. They are only giving the micro details of the request that you made. If you ask for someone’s address, the API will only give you that person’s address - not gender, education, or any other detail. Another way of integration is where you are having to clone the data completely. That is, getting the data dumps from the system on a scheduled basis. There are advantages and disadvantages to both. In the first approach, you’re only getting a piece of data, and if you want more data you have to call other APIs. You have to make multiple calls to get all of the details. When it comes to the data dump world, you have all of the access to all of the data but the data is not real-time. If someone has changed their information, you wouldn’t know until the next refresh comes in. With virtualization, you can get the real-time data and complete data at the same time. You’re standardizing access to the data by taking the best of breed of all integration approaches.

When you create a data set in Loxio, it is exposing the data in two different ways. One way is, it creates a microservice. If someone wants access to the data, it also creates a view you can look into where access controls are being maintained at the webservice layer as well as the view layer. If a table has 20 columns, we can expose only 5 of those columns for someone with lower access abilities. Similarly, if someone comes in with higher access permissions, then we can quickly create a dataset with additional columns in it and then expose it to that role. If someone only wants subset access, it gives subset access through APIs. If someone wants full access, it gives the full access using the views.
Making Everyone A Data Analyst With A Semantic Layer
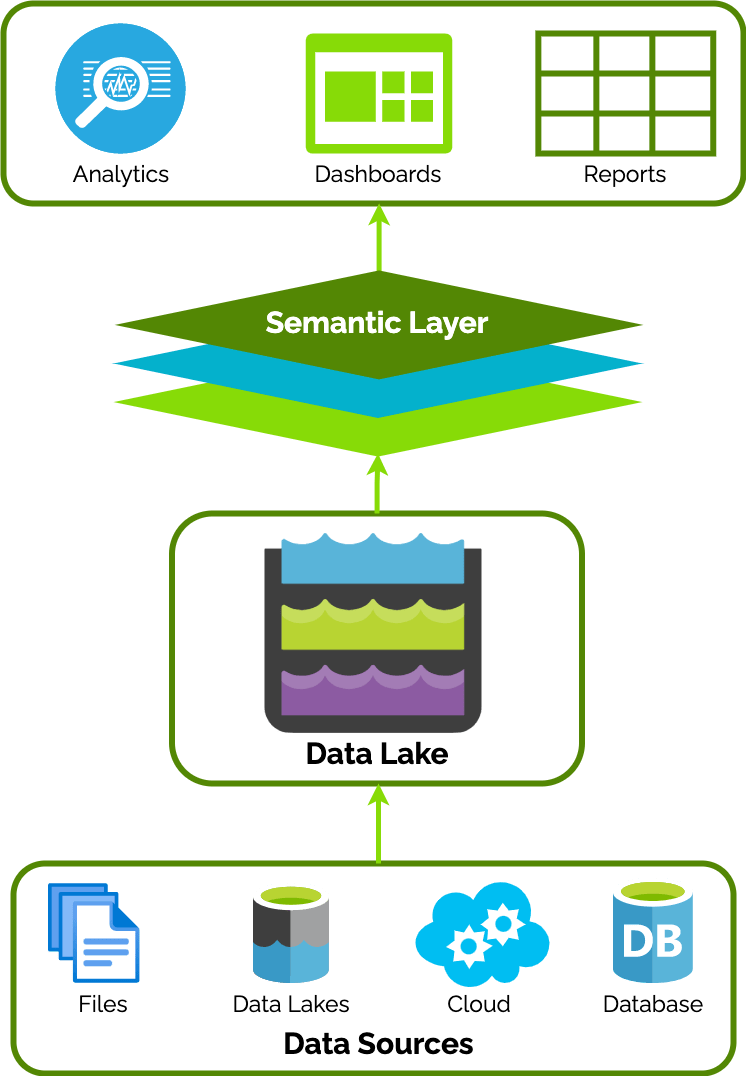
The semantic layer is a major element of data virtualization. A semantic layer is a layer of abstraction that hides the complexities of data to provide a consistent way of interpreting data. The semantic layer turns complex data into familiar terms so that people all across an organization can confidently access the same single source of data. The semantic layer provides consistency as well as simplicity. With the complexities hidden, business users can more easily interpret data. The semantic layer presents the data in a way that business users can understand without the help of a data analyst.
The whole point of Loxio is to take complex, raw data and make it user-friendly so that the average citizen can go in there and create their own reports. That’s essentially what a semantic layer is, it presents the data that’s useful in terms that are digestible to the end user. For example, the raw data could come in as n_0_1 being the first names column and n_0_2 being the last name column. The semantic layer would say, “Well that’s crazy. No one’s going to know what that means. I’m going to present this to the user and I’m going to call it First Name and Last Name.” That’s what Loxio does. The Datasets module takes this complex data and allows the business analyst to rename things, present things, and hide things such as columns that don’t mean anything.

Using Augmented Analytics For Predictive and Prescriptive Analyses
According to Gartner, “Augmented analytics is the use of enabling technologies such as machine learning and AI to assist with data preparation, insight generation and insight explanation to augment how people explore and analyze data in analytics and BI platforms.” Predictive and prescriptive analytics turn metrics into insights that lead to business decisions. Virtualization provides data scientists with access to more data which, in turn, allows for more robust analytics and better prescriptive or predictive models. The more information that gets fed into your predication, the more accurate your analyses will be. For example, if you only have prescription data, you can do some analysis, but what would really make your analysis better is when you can supplement that data, or augment that data with other data.

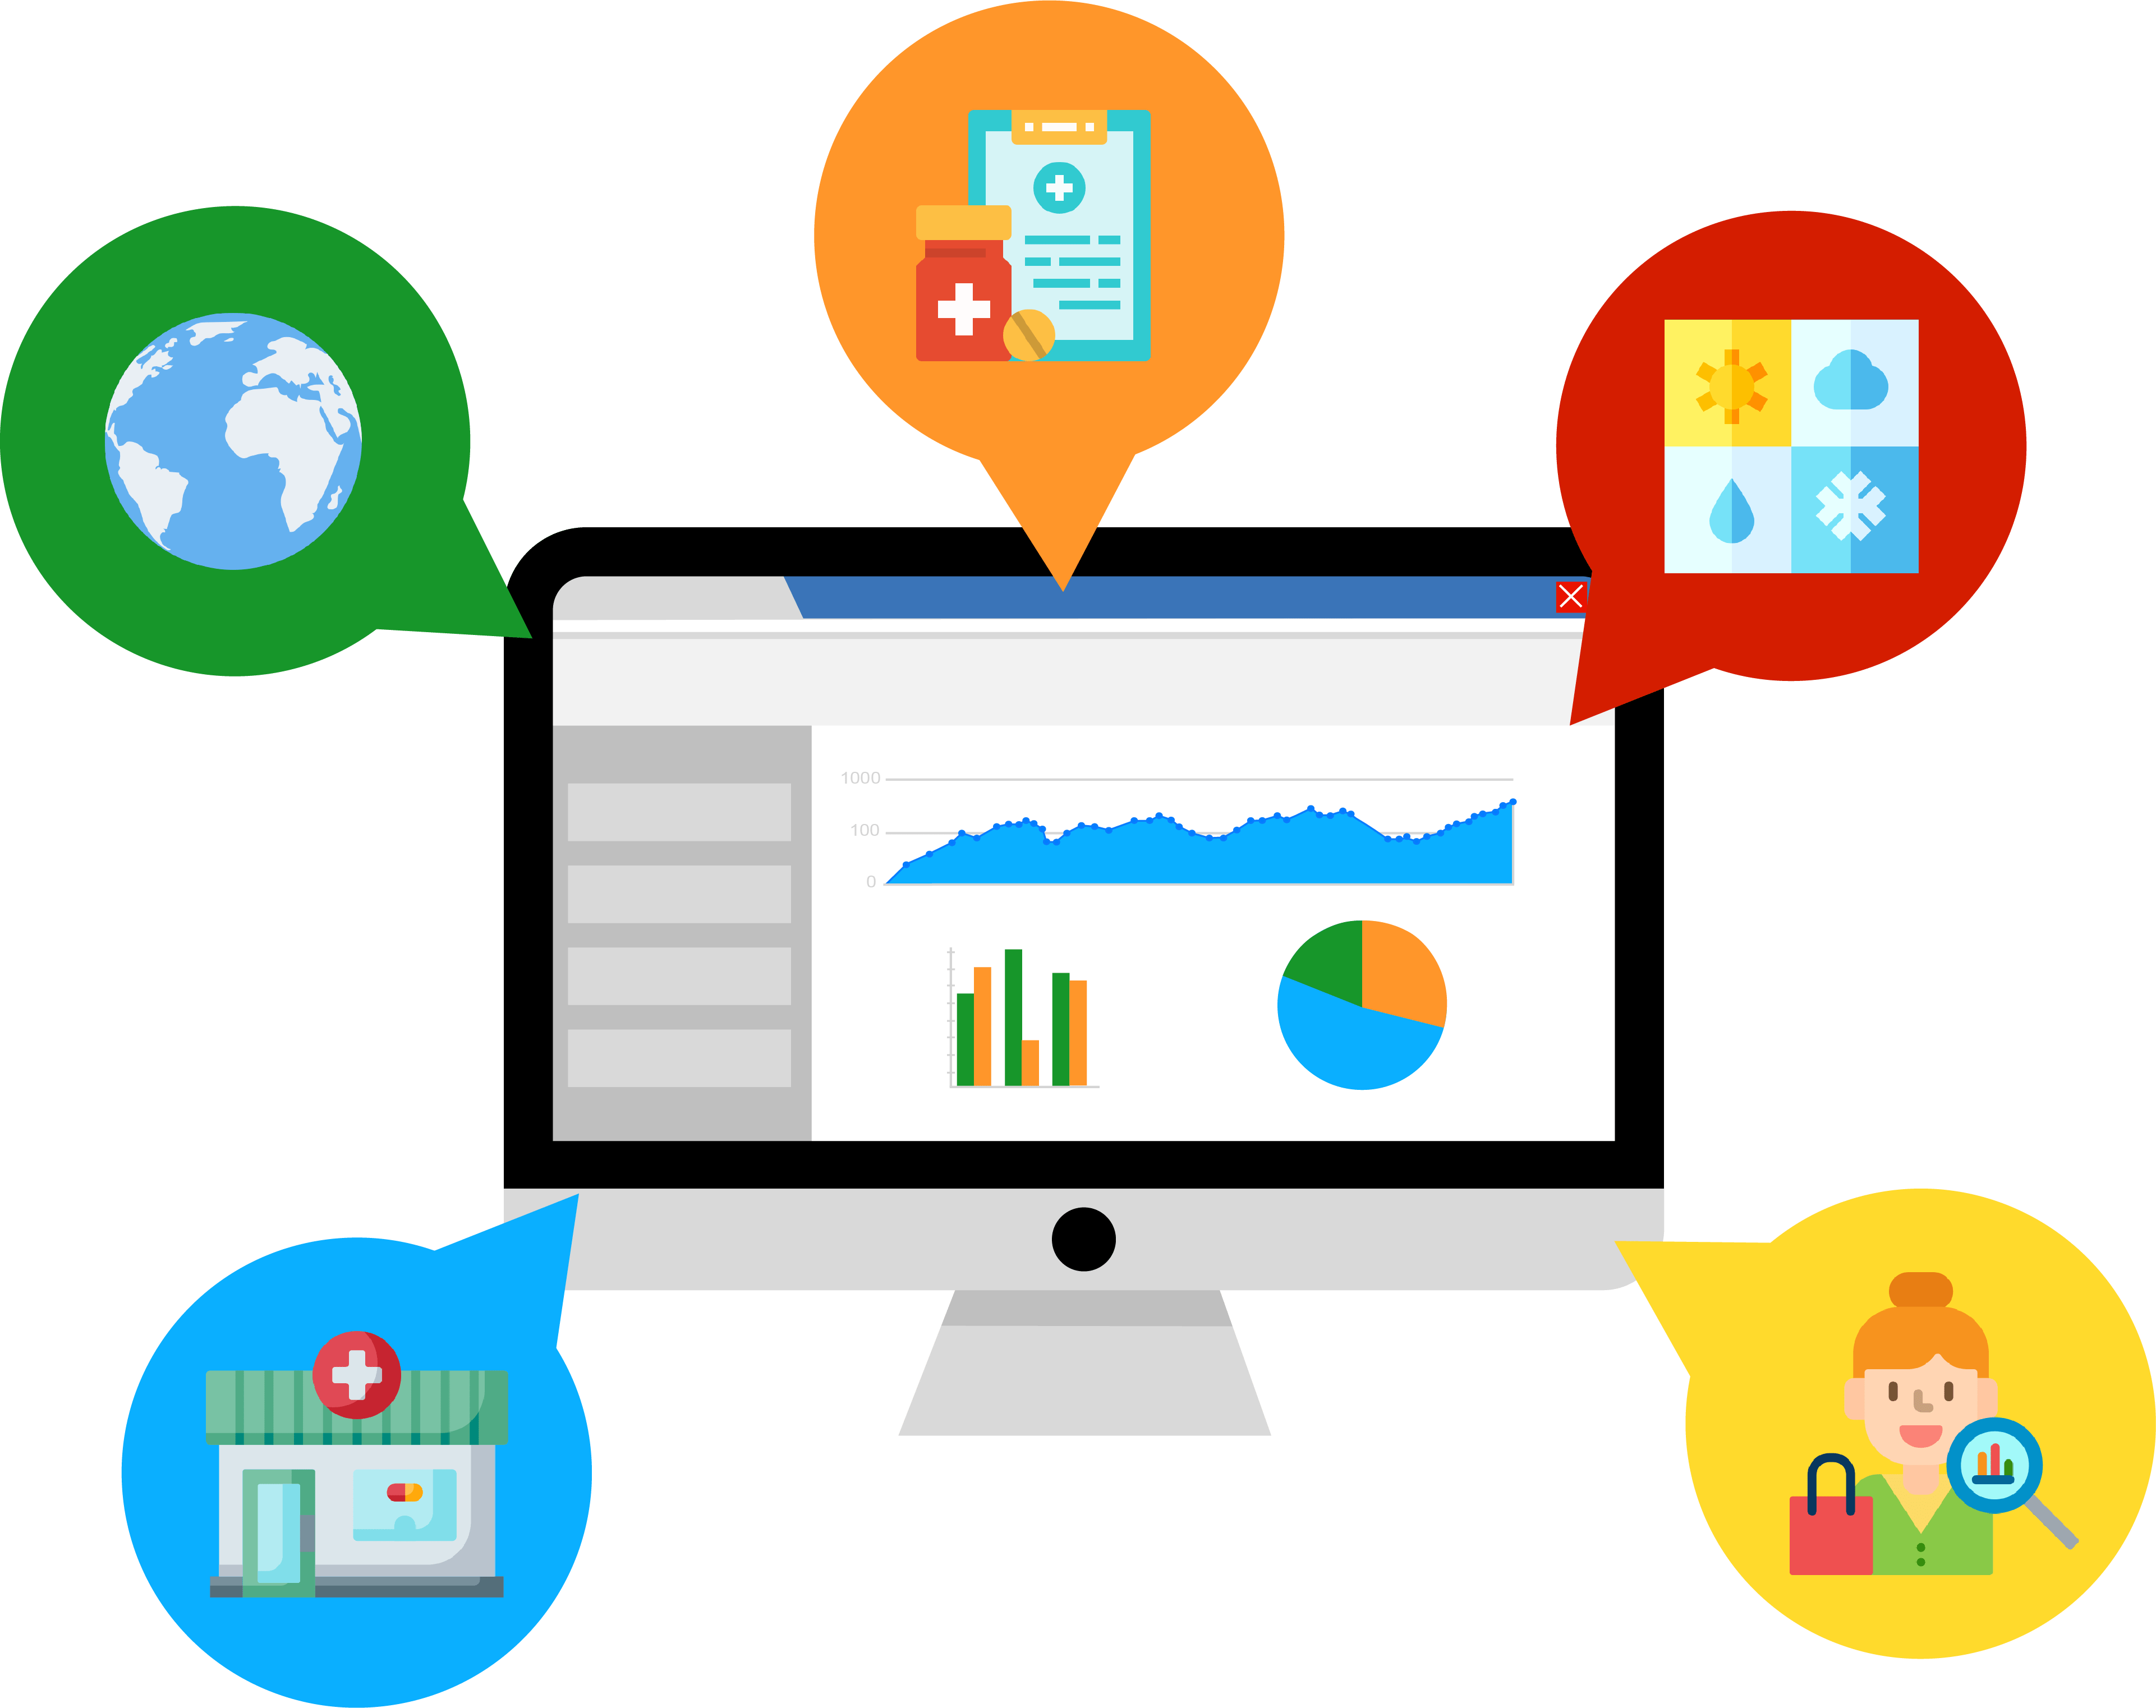
For example, what if you have prescriptions + pharmacy information + geolocation information? You can combine all of this together and now you have a whole host of data elements that you can do better analysis on. All of these types of analytics work together in data virtualization to optimize data to make the best business decisions.
Loxio gives you the ability to augment data when we are actually consuming data. With the help of data virtualization, if we have a dataset that is exposed from one system, and then we have datasets exposed from another system, we now have the ability to combine these two datasets and present them as one dataset to the outside world. Now, you have augmented data that is available at run time and you don’t have to store it internally.
Sources
Anand, A. (2020, January 13). What is a semantic layer? how to build it for future data workloads? Kyvos Insights. Retrieved October 2021, from https://www.kyvosinsights.com/blog/what-is-a-semantic-layer-how-to-build-one-that-can-handle-future-data-workloads/.
Heslop, B. (2021, January 22). How augmented and predictive analytics make the most of your data. contentstack. Retrieved October 2021, from https://www.contentstack.com/blog/all-about-headless/use-predictive-analytics-augmented-analytics-make-most-of-data/.
Neylon, C. (2017, October 24). Building a culture of data sharing: Policy design and implementation for Research Data Management in Development Research. Research Ideas and Outcomes. Retrieved October 2021, from https://riojournal.com/article/21773/.
Paladino, M. (2021, April 16). Council post: Breaking down data silos takes a cultural shift. Forbes. Retrieved October 2021, from https://www.forbes.com/sites/forbestechcouncil/2021/04/16/breaking-down-data-silos-takes-a-cultural-shift/?sh=7390710a845f.
